
Understanding dashboards and reports
Use the Dashboard for a time-bounded performance summary and Reports for focused breakdowns and exports. Align the period, population, and currency before comparing figures across views.
Who can use this guide
Section titled “Who can use this guide”This guide applies to all roles, subject to report permissions and subscription entitlements.
Prerequisites
Section titled “Prerequisites”Before you begin, confirm that you have:
- Current and relevant data
- The period you want to review
- The organisation’s default currency
- Access to the required dashboard and reports
Review performance
Section titled “Review performance”- Open Dashboard.
- Select Today, Week, Month, All, or Custom.
- Review the available KPI cards. These may include Commissions Earned, Forecasted Commission/Revenue, Revenue, Commission %, Total Deals Volume, Performance, Growth, and Active Employees.
- Keep forecast-labelled estimates separate from actual results.
- Review the available supporting views, such as Commission Trend, Target Progress, Top Performers/Earners, Intelligence Beta, Insights, Regions, Recent Deals/Transactions, Categories, Financial Overview, and Disputes.
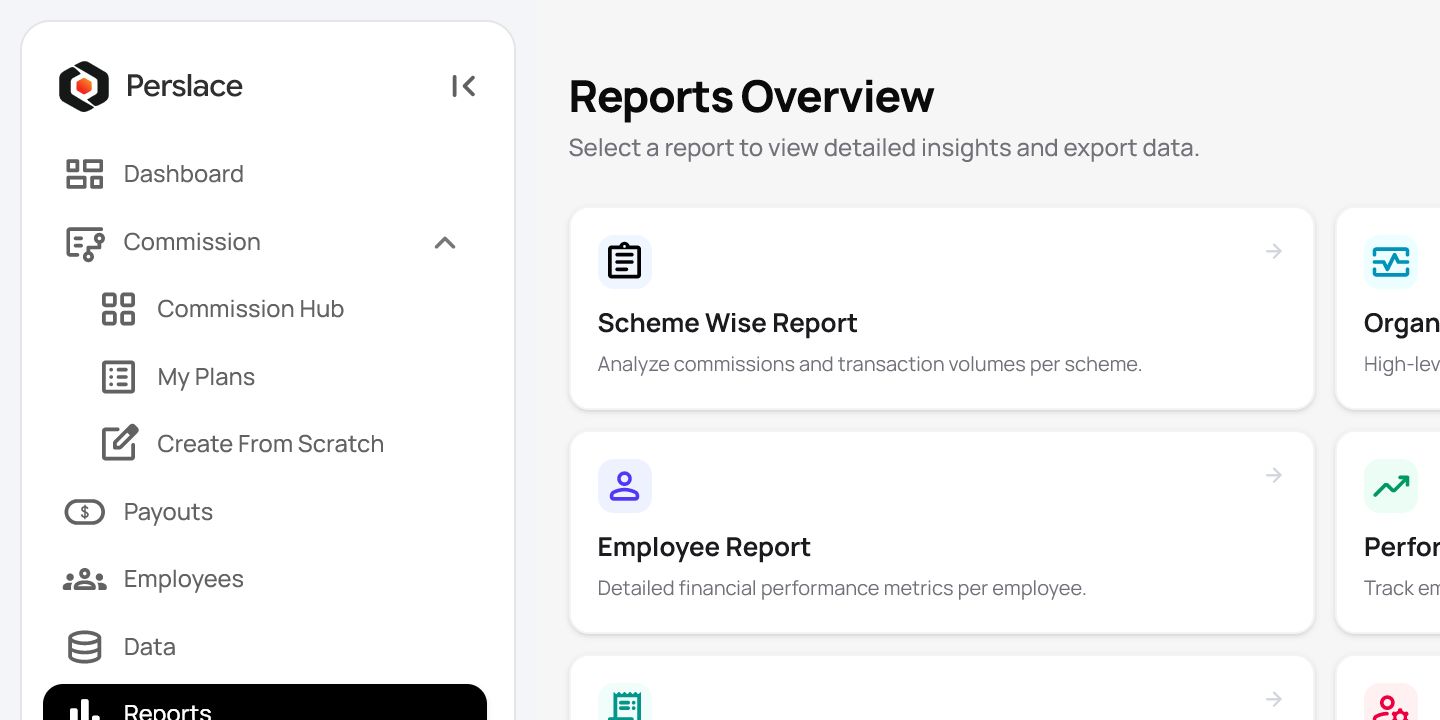
- Open Reports.
- Choose the report that matches your question. Verified options include Scheme Wise, Organisation Summary, Group Wise, Employee, Performance, Dispute, Deals, Client Performance, and Payout.
- Choose a date range or Quick Select, then apply the filter.
- Before comparing views, confirm that their period, scope, and currency match.
- Select CSV or PDF when an export is needed.
Important: Treat exported reports as financial and personnel information. Store, share, and delete them according to your organisation’s security policy.
- Use Custom Report Builder only if your subscription includes it. The reviewed interface showed this feature as Enterprise-gated.
Expected result
Section titled “Expected result”You can move from a time-bounded dashboard summary to the appropriate focused report or export, using matching scope and filters.
Important notes
Section titled “Important notes”- Reports use the organisation’s default currency.
- No standalone Forecasting page was found during product review. Forecast cards, Historical Replay, and the AI Impact Simulator (AIS) were the observed forecasting-related surfaces. AIS checks schemes against historical months to show their potential impact.
- Dashboard and report availability varies by role and subscription.
Troubleshooting
Section titled “Troubleshooting”Dashboard and report totals differ
Section titled “Dashboard and report totals differ”Match the period, population, currency, actual-versus-forecast basis, workflow states, and data-refresh state.
A report is missing
Section titled “A report is missing”Check your account role and subscription entitlement.
An export does not match the on-screen report
Section titled “An export does not match the on-screen report”Reapply the filters, confirm the selected period, and generate a new export.
A forecast is unexpected
Section titled “A forecast is unexpected”Validate current data, employee assignments, and scheme logic. Treat the forecast as an estimate, not an approved financial result.
Related articles
Section titled “Related articles”- Choosing the right report
- Reconciling dashboard, report, and imported totals
- Understanding dashboard forecasts
- Using Perslace Intelligence
Last updated: August 2026